
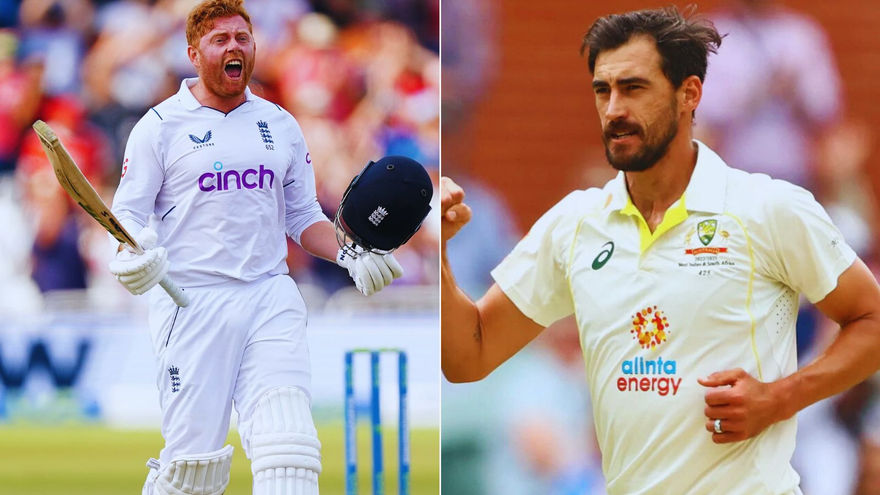
When Jonny Bairstow comes up against Mitchell Starc, it's a battle between an aggressive batter and a fast left-arm bowler. Bairstow likes to score quickly, while Starc is known for his speed and swing. Their matchups have happened mostly in Tests and ODIs, and the stats show some interesting patterns.
In this article, we look at how Bairstow has performed against Starc, and who has done better in their head-to-head contests.
Jonny Bairstow vs Mitchell Starc Head-to-Head Stats Summary
Overall, across formats, Starc has dismissed Bairstow 18 times, keeping him quiet and rarely allowing him to take control of the matchup.
Format | Runs | Balls | Outs | Dots | 4s | 6s | Avg | SR |
TEST | 200 | 379 | 12 | 283 | 25 | 1 | 16.7 | 52.8 |
ODI | 93 | 96 | 5 | 58 | 11 | 3 | 18.6 | 96.9 |
T20I | 16 | 18 | 1 | 13 | 3 | 0 | 16.0 | 88.9 |
Total | 309 | 493 | 18 | 354 | 39 | 4 | - | - |
Jonny Bairstow vs Mitchell Starc: Year-by-Year Head to Head Stats in Test Cricket
In Test cricket, Bairstow has scored 200 runs off 379 balls against Starc, getting out 12 times. His strike rate in Tests stands at 52.8, with a modest average of 16.7, indicating that Starc has often had the upper hand in the longest format.
Year | Runs | Balls | Outs | Dots | 4s | 6s | Avg | SR |
2013 | 20 | 45 | 2 | 35 | 3 | 0 | 10.0 | 44.4 |
2015 | 22 | 33 | 0 | 24 | 4 | 0 | – | 66.7 |
2017 | 56 | 103 | 4 | 83 | 10 | 0 | 14.0 | 54.4 |
2018 | 4 | 16 | 0 | 12 | 0 | 0 | – | 25.0 |
2019 | 9 | 19 | 2 | 15 | 1 | 0 | 4.5 | 47.4 |
2021 | 18 | 31 | 1 | 23 | 2 | 0 | 18.0 | 58.1 |
2022 | 25 | 54 | 0 | 39 | 1 | 0 | – | 46.3 |
2023 | 46 | 78 | 3 | 52 | 4 | 1 | 15.3 | 59.0 |
Total | 200 | 379 | 12 | 283 | 25 | 1 | 16.7 | 52.8 |
Jonny Bairstow vs Mitchell Starc: Year-by-Year Head to Head Stats in ODI Cricket
In ODIs, Bairstow has fared slightly better. He has scored 93 runs from 96 balls against Starc, with 5 dismissals. His average in ODIs is 18.6, and a strike rate close to 97 shows that he has tried to be more aggressive.
Year | Runs | Balls | Outs | Dots | 4s | 6s | Avg | SR |
2015 | 11 | 6 | 0 | 3 | 1 | 1 | – | 183.3 |
2018 | 30 | 31 | 2 | 18 | 3 | 1 | 15.0 | 96.8 |
2019 | 18 | 16 | 1 | 8 | 3 | 0 | 18.0 | 112.5 |
2020 | 34 | 42 | 1 | 28 | 4 | 1 | 34.0 | 81.0 |
2023 | 0 | 1 | 1 | 1 | 0 | 0 | 0.0 | 0.0 |
Total | 93 | 96 | 5 | 58 | 11 | 3 | 18.6 | 96.9 |
Jonny Bairstow vs Mitchell Starc: Year-by-Year Head to Head Stats in T20I Cricket
In T20Is, the sample size is smaller, but the story remains consistent. Bairstow has managed 16 runs from 18 balls, with one dismissal, at a strike rate of 88.9.
Year | Runs | Balls | Outs | Dots | 4s | 6s | Avg | SR |
2020 | 16 | 18 | 1 | 13 | 3 | 0 | 16.0 | 88.9 |
Total | 16 | 18 | 1 | 13 | 3 | 0 | 16.0 | 88.9 |
Verdict: Jonny Bairstow vs Mitchell Starc Who Has the Edge?
Looking at the numbers across all formats, Mitchell Starc clearly holds the edge over Jonny Bairstow. The Australian speedster has dismissed Bairstow 18 times across Tests, ODIs, and T20Is — with 12 of those coming in Test cricket alone. Bairstow’s averages against Starc are relatively low in every format.
So, in this head-to-head battle, Mitchell Starc comes out on top.
Must Read |