
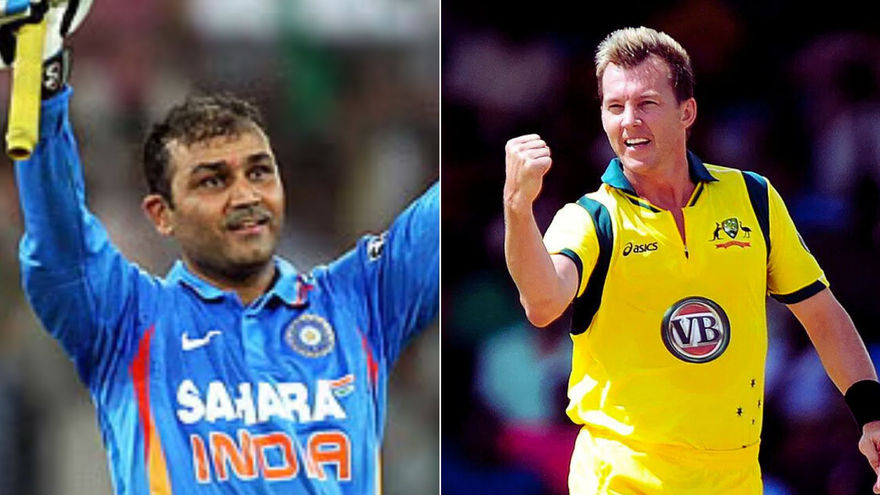
Virender Sehwag vs Brett Lee was one of the most exciting individual battles in cricket. On one side was Sehwag, a fearless opener known for his aggressive batting style and ability to dominate bowlers from the very first ball. On the other side stood Brett Lee, one of the fastest bowlers in world cricket, famous for his pace, bounce, and sharp accuracy. Every time these two players faced each other, fans knew they were about to witness a high-intensity contest.
In this article, we look at their head-to-head stats across formats to understand how Sehwag performed against Lee and who had the edge in this explosive rivalry.
Virender Sehwag vs Brett Lee Head-to-Head Stats Summary
Across international cricket and the IPL, Sehwag faced 496 balls from Brett Lee and scored 385 runs while getting out 12 times.
Format | Runs | Balls | Outs | Dots | 4s | 6s | Avg | SR |
Test | 234 | 313 | 5 | 202 | 28 | 1 | 46.8 | 74.8 |
ODI | 103 | 131 | 4 | 84 | 16 | 0 | 25.8 | 78.6 |
T20I | 17 | 24 | 2 | 16 | 3 | 0 | 8.5 | 70.8 |
IPL | 31 | 28 | 1 | 12 | 5 | 0 | 31.0 | 110.7 |
Total | 385 | 496 | 12 | 314 | 52 | 1 | 112.1 | 334.9 |
Sehwag vs Brett Lee: Year-by-Year Head to Head Stats in Test Cricket
In Test cricket, Sehwag faced 313 deliveries from Brett Lee and scored 234 runs, getting out 5 times.
Year | Runs | Balls | Outs | Dots | 4s | 6s | Avg | SR |
2003 | 40 | 46 | 1 | 30 | 5 | 0 | 40.0 | 87.0 |
2004 | 26 | 18 | 0 | 7 | 3 | 1 | – | 144.4 |
2005 | 33 | 32 | 0 | 22 | 7 | 0 | – | 103.1 |
2008 | 135 | 217 | 4 | 143 | 13 | 0 | 33.8 | 62.2 |
Total | 234 | 313 | 5 | 202 | 28 | 1 | 46.8 | 74.8 |
Sehwag vs Brett Lee: Year-by-Year Head to Head Stats in ODI
In One Day Internationals, Sehwag managed 103 runs off 131 balls, with 4 dismissals.
Year | Runs | Balls | Outs | Dots | 4s | 6s | Avg | SR |
2003 | 15 | 29 | 1 | 24 | 3 | 0 | 15.0 | 51.7 |
2004 | 5 | 11 | 0 | 6 | 0 | 0 | – | 45.5 |
2005 | 17 | 18 | 1 | 9 | 2 | 0 | 17.0 | 94.4 |
2006 | 26 | 25 | 1 | 12 | 3 | 0 | 26.0 | 104.0 |
2008 | 24 | 27 | 0 | 19 | 5 | 0 | – | 88.9 |
2009 | 8 | 7 | 1 | 5 | 2 | 0 | 8.0 | 114.3 |
2011 | 7 | 9 | 0 | 5 | 1 | 0 | – | 77.8 |
2012 | 1 | 5 | 0 | 4 | 0 | 0 | – | 20.0 |
Total | 103 | 131 | 4 | 84 | 16 | 0 | 25.8 | 78.6 |
Sehwag vs Brett Lee: Year-by-Year Head to Head Stats in T20Is
In T20 Internationals, the battle tilted in favour of Lee. Sehwag scored just 17 runs from 24 balls, with 2 dismissals.
Year | Runs | Balls | Outs | Dots | 4s | 6s | Avg | SR |
2007 | 6 | 10 | 1 | 7 | 1 | 0 | 6.0 | 60.0 |
2008 | 0 | 3 | 0 | 3 | 0 | 0 | – | 0.0 |
2012 | 11 | 11 | 1 | 6 | 2 | 0 | 11.0 | 100.0 |
Total | 17 | 24 | 2 | 16 | 3 | 0 | 8.5 | 70.8 |
Sehwag vs Brett Lee: Year-by-Year Head to Head Stats in IPL
In the IPL, Sehwag and Lee met several times. Sehwag scored 31 runs from 28 balls, getting out only once.
Year | Runs | Balls | Outs | Dots | 4s | 6s | Avg | SR |
2008 | 6 | 3 | 0 | 0 | 1 | 0 | – | 200.0 |
2009 | 8 | 6 | 1 | 4 | 2 | 0 | 8.0 | 133.3 |
2011 | 6 | 6 | 0 | 3 | 1 | 0 | – | 100.0 |
2012 | 4 | 5 | 0 | 1 | 0 | 0 | – | 80.0 |
2013 | 7 | 8 | 0 | 4 | 1 | 0 | – | 87.5 |
Total | 31 | 28 | 1 | 12 | 5 | 0 | 31.0 | 110.7 |
Verdict: Virender Sehwag vs Brett Le Who Has the Edge?
The Sehwag vs Brett Lee battle was filled with intensity, boundaries, and quick dismissals. Sehwag managed to score freely at times—especially in Test matches—while Lee succeeded in disrupting Sehwag’s rhythm across formats. In Tests, Sehwag held the advantage, with a strong average and consistent scoring. But in T20Is and ODIs, Lee often had the upper hand.
Overall, it was a close battle—Sehwag showed flashes of dominance, but Brett Lee's pace ensured he stayed a constant threat.